Verify Agent Status
After enrolling and starting the agent, use the following methods to confirm it is running correctly and communicating with the platform.
Method 1 — Check the systemd Service
systemctl status pmp4pg-agent
A healthy agent shows:
● pmp4pg-agent.service - PMP4PG Monitoring Agent
     Loaded: loaded (/usr/lib/systemd/system/pmp4pg-agent.service; enabled)
     Active: active (running) since 2025-01-15 10:23:11 UTC; 5min ago
   Main PID: 12345 (pmp4pg-agent)
If the service shows failed or inactive, check the logs:
tail -f /var/log/pmp4pg/agent.log
Method 2 — Check the Agent Logs
The agent logs to /var/log/pmp4pg/agent.log (managed by logrotate).
# Live log stream
tail -f /var/log/pmp4pg/agent.log

# Last 50 lines
tail -50 /var/log/pmp4pg/agent.log
Signs of a healthy agent:
level=info msg="PMP4PG Agent starting" version=1.0.0
level=info msg="Connected to PostgreSQL" host=localhost port=5432
level=info msg="Batch sent successfully" component=ash_sender status_code=201
level=info msg="Batch sent successfully" component=pg_stat_database_sender status_code=201
level=info msg="Heartbeat sent successfully" component=heartbeat_sender status_code=200
Signs of a problem:
level=error msg="Failed to connect to PostgreSQL" error="..."
level=error msg="Failed to send batch" component=ash_sender error="connection refused"
level=warn  msg="Retrying" attempt=2 delay=5s
Method 3 — Check the Platform Dashboard
Open your browser and navigate to your PMP4PG backend:
https://<your-backend-host>:443
The monitored server should appear in the Global Dashboard with:
- Status ACTIVE (green) — agent is running and sending heartbeats
- Last heartbeat timestamp updated within the last minute
- Agent version displayed in the Server Detail page
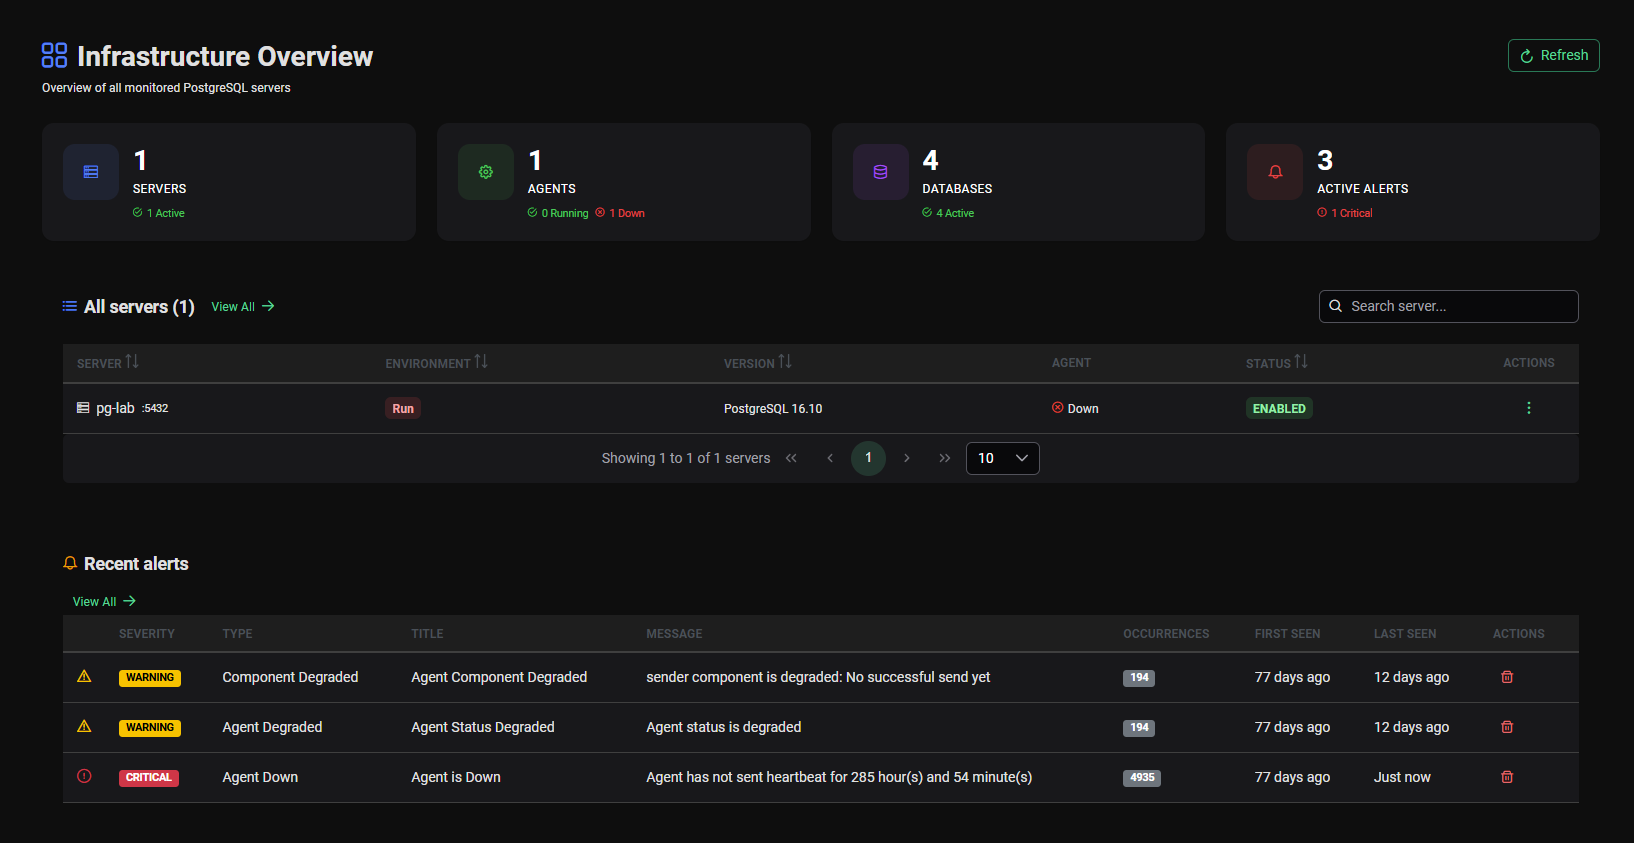
It may take up to 60 seconds after agent startup for the status to switch from INACTIVE to ACTIVE — this matches the heartbeat interval configured in agent.conf.
Method 4 — Server Detail Page
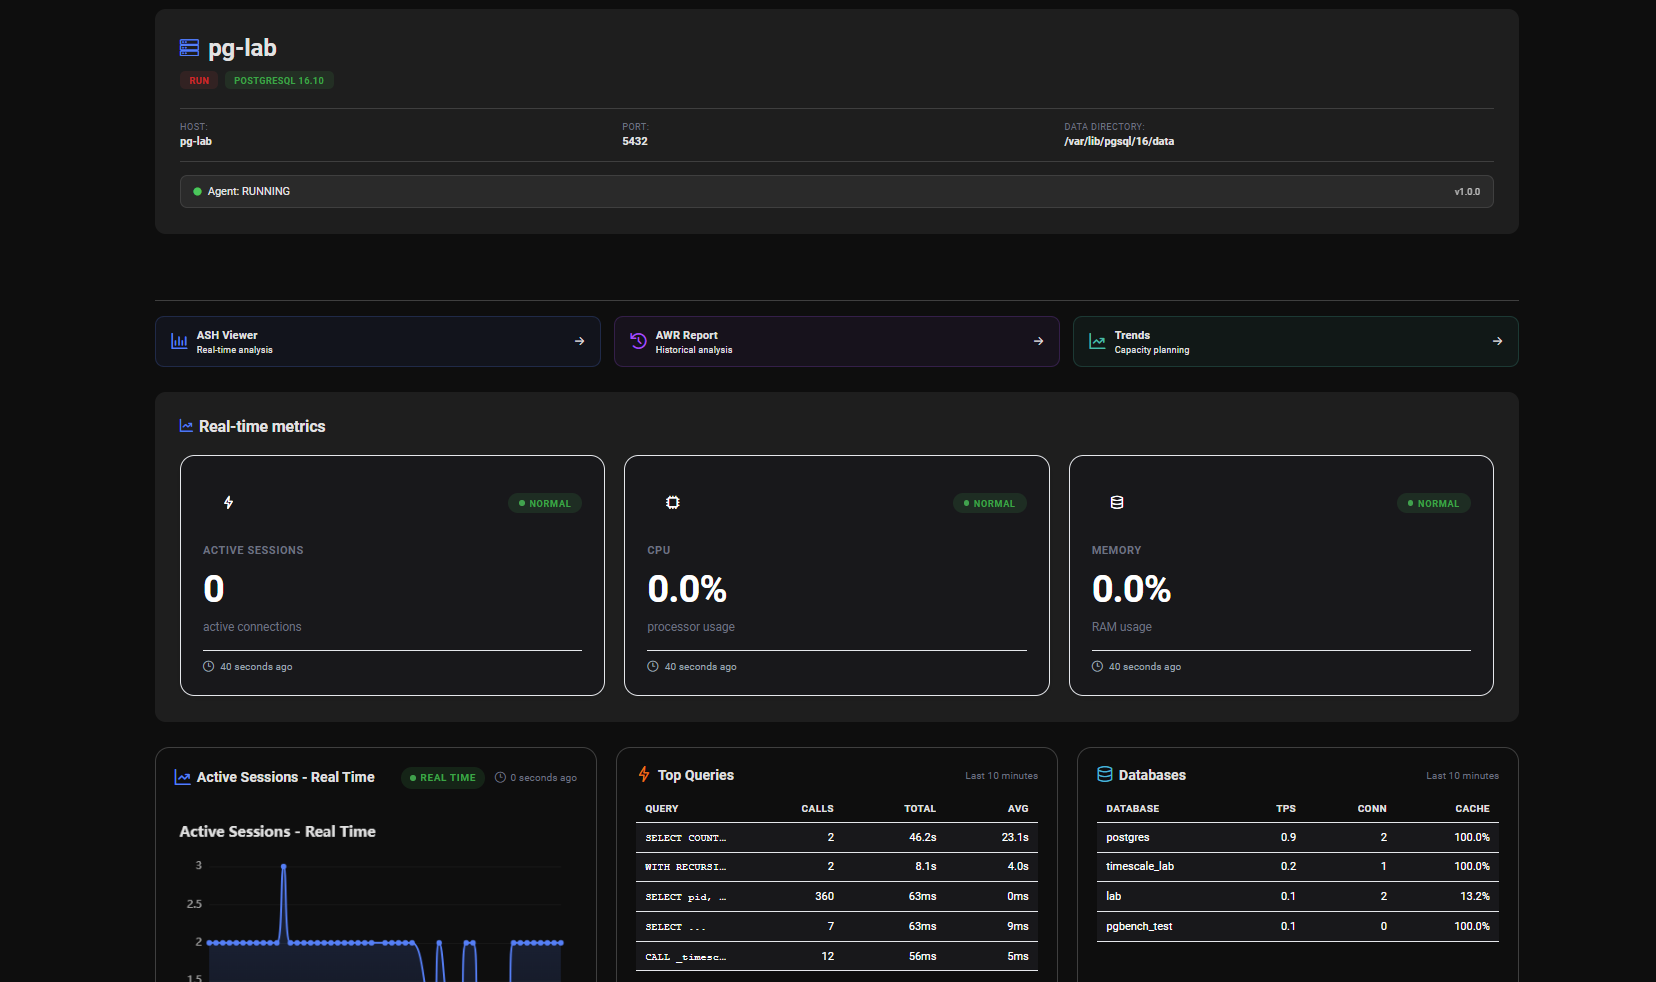
Click on the server in the dashboard to open the Server Detail page. The Agent Status tab shows:
| Field | Expected Value |
|---|---|
| Agent Status | ACTIVE |
| Last Heartbeat | Less than 1 minute ago |
| Agent Version | 1.0.0 |
| Agent ID | UUID matching agent.id in agent.conf |
| Server ID | UUID matching server.id in agent.conf |
Common Issues
Agent starts but status stays INACTIVE in the dashboard
- Verify
backend.urlin/etc/pmp4pg/agent.confis correct and reachable - Confirm
agent.id,agent.api_keyandserver.idare correctly set - Check for firewall rules blocking outbound HTTPS (443) from the agent host
# Test connectivity to the backend
curl -v https://<backend-host>:443/pmp/actuator/health
Agent fails to start after registration
- Confirm
registration_tokenhas been cleared inagent.conf - Verify
agent.id,agent.api_keyandserver.idare all filled
grep "id\|api_key\|registration_token" /etc/pmp4pg/agent.conf
No ASH data appearing in ASH Viewer
- Confirm the PostgreSQL monitoring user has the
pg_monitorrole - Verify
collectors.ash.enabledistrueinagent.conf - Test the connection manually:
-- Connect as the monitoring user and check pg_stat_activity
SELECT count(*) FROM pg_stat_activity;
No query data in Top SQL
- Confirm
pg_stat_statementsextension is installed:
SELECT * FROM pg_stat_statements LIMIT 1;
-
If the query fails, the extension is not installed. See Prerequisites →
-
Verify
collectors.pg_stat_statements.enabledistrueinagent.conf
Useful Commands
# Check service status
systemctl status pmp4pg-agent

# Start / Stop / Restart
systemctl start pmp4pg-agent
systemctl stop pmp4pg-agent
systemctl restart pmp4pg-agent

# Live logs
tail -f /var/log/pmp4pg/agent.log

# Check config file
cat /etc/pmp4pg/agent.conf

# Check agent version
/usr/bin/pmp4pg-agent --version