Load Profile
The Load Profile is the first analytical section of the AWR report. It provides a high-level summary of the database workload during the report period, expressed as rates per second and per transaction.
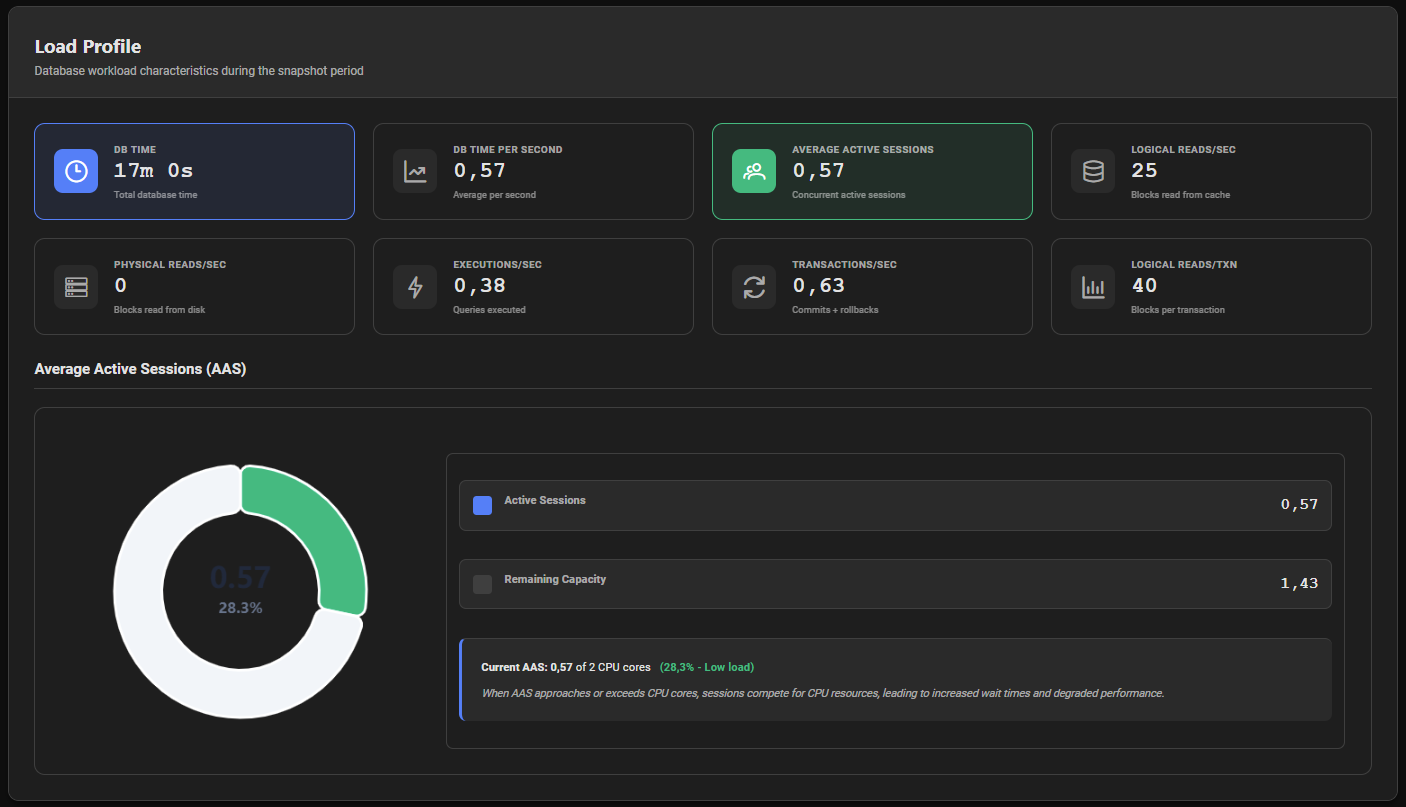
How DB Time and AAS Are Calculated
PMP4PG samples data of pg_stat_activity every 10 seconds (10% sampling rate). Each sample therefore represents 10 seconds of real database activity.
DB Time (seconds) = Total ASH samples × 10
AAS = DB Time / Report Duration (seconds)
Example: If 180 ASH samples were captured over a 30-minute snapshot:
- DB Time = 180 × 10 = 1,800 seconds (30 minutes)
- AAS = 1,800 / 1,800 = 1.0 — on average, 1 session was active at all times
DB Time is the sum of CPU time and wait time across all active sessions during the report period.
Metric Cards
The Load Profile displays 8 metric cards:
| Metric | Description |
|---|---|
| DB Time | Total database time during the report period (CPU + Wait time across all sessions) |
| DB Time per Second | Average DB Time consumed per second — equivalent to AAS |
| Average Active Sessions (AAS) | Average number of concurrently active sessions during the period |
| Logical Reads/sec | Rate of block reads served from the buffer cache |
| Physical Reads/sec | Rate of block reads from disk (cache misses) |
| Executions/sec | Rate of SQL statement executions |
| Transactions/sec | Rate of committed and rolled-back transactions |
| Logical Reads/txn | Average number of buffer cache reads per transaction |
Average Active Sessions (AAS) Chart
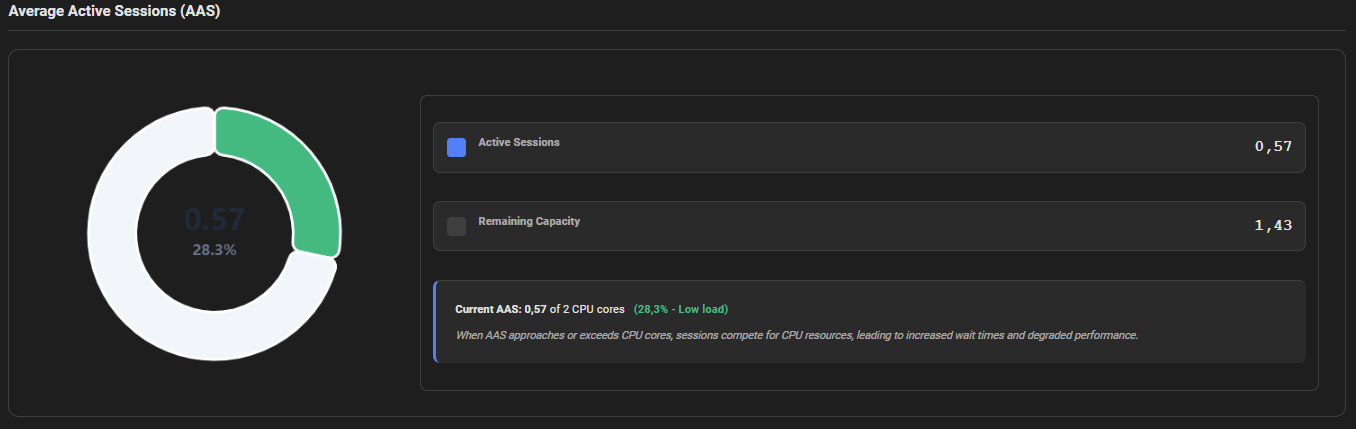
Below the metric cards, a doughnut chart visualizes the AAS relative to the available CPU capacity of the server.
- Active Sessions — current AAS value (sessions consuming DB time)
- Remaining Capacity — unused CPU capacity (CPU cores − AAS)
AAS Interpretation
| AAS vs CPU Cores | Load Level | Meaning |
|---|---|---|
| AAS < 50% of CPU cores | 🟢 Low | Database is lightly loaded — plenty of headroom |
| 50% ≤ AAS < 80% of CPU cores | 🟡 Moderate | Normal production load — monitor trends |
| AAS ≥ 80% of CPU cores | 🔴 High | Sessions are competing for CPU — investigate Top SQL and Wait Events |
When AAS approaches or exceeds the number of available CPU cores, sessions compete for CPU resources, leading to increased wait times and degraded performance. Investigate the Top SQL section for CPU-intensive queries and the Wait Events section for lock or I/O contention.
How to Read the Load Profile
DB Time vs. Duration
DB Time represents the total work done by the database, not wall-clock time. A DB Time of 3,600 seconds over a 30-minute (1,800-second) period means an AAS of 2.0 — on average, 2 sessions were always active.
Physical Reads/sec
A high Physical Reads/sec relative to Logical Reads/sec indicates a low buffer cache hit ratio — data is frequently read from disk rather than memory. Consider increasing shared_buffers or investigating queries performing large sequential scans.
Executions/sec vs. Transactions/sec
A high ratio of Executions/sec to Transactions/sec indicates many queries per transaction — typical of OLTP workloads. A low ratio may indicate long-running transactions with few statements.
Logical Reads/txn
A high Logical Reads/txn value indicates transactions reading large amounts of data. For OLTP workloads, values above a few hundred blocks per transaction warrant investigation of query plans for missing indexes.