Segment Statistics (I/O)
The Segment Statistics section analyzes disk and buffer cache I/O activity at the table and index level during the report period. It identifies which tables and indexes generated the most I/O and highlights those with poor cache hit ratios.
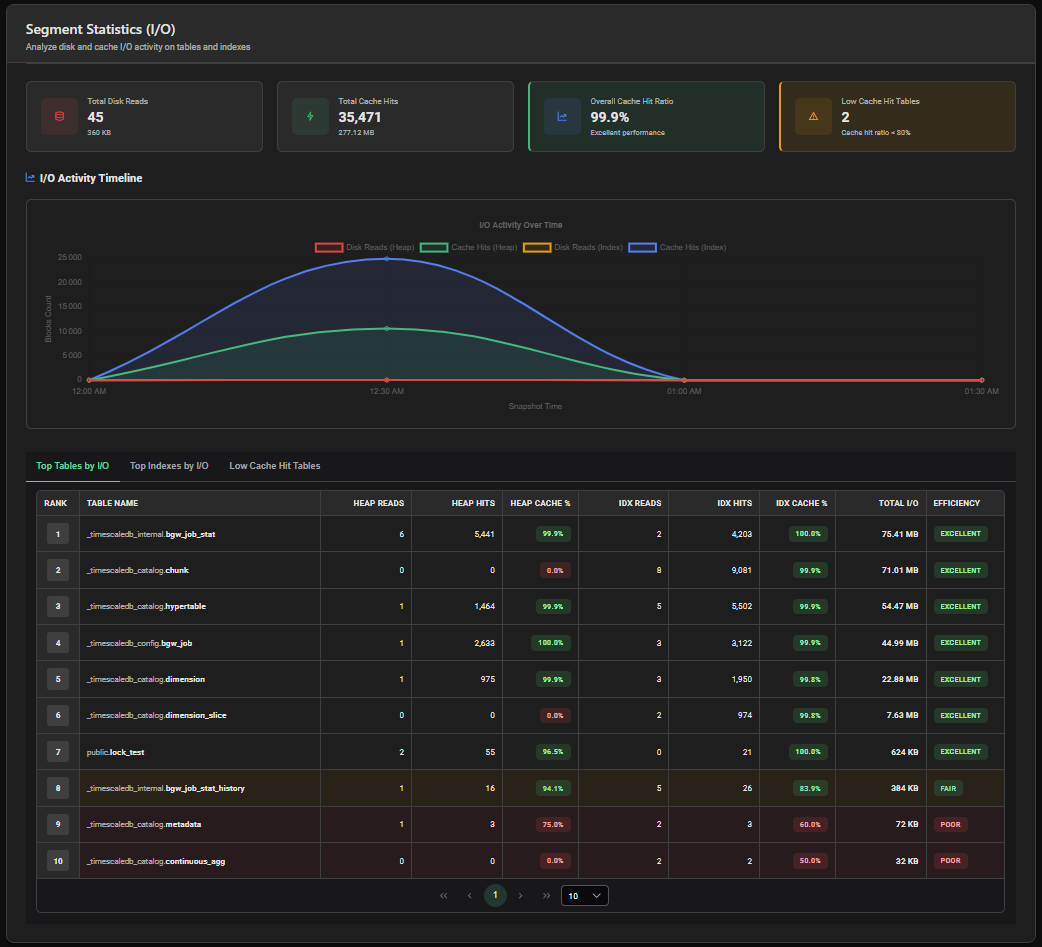
Summary Cards
| Card | Description |
|---|---|
| Total Disk Reads | Total blocks read from disk + estimated data volume |
| Total Cache Hits | Total blocks served from the buffer cache + estimated data volume |
| Overall Cache Hit Ratio | Global cache efficiency across all tables and indexes — highlighted green if ≥ 95% |
| Low Cache Hit Tables | Number of tables with cache hit ratio < 80% — highlighted orange if > 0 |

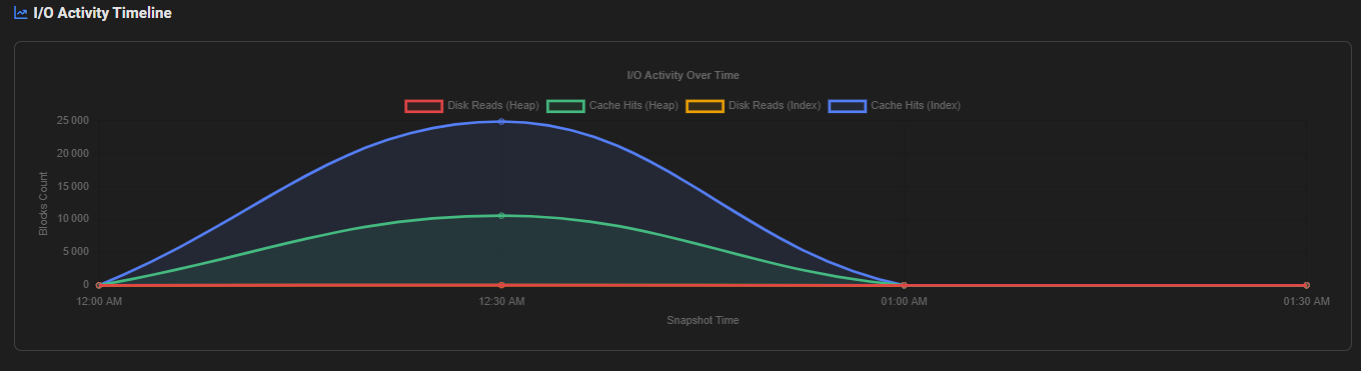
I/O Activity Timeline
A line chart showing disk read and cache hit activity over the report period, allowing you to correlate I/O peaks with specific time windows.
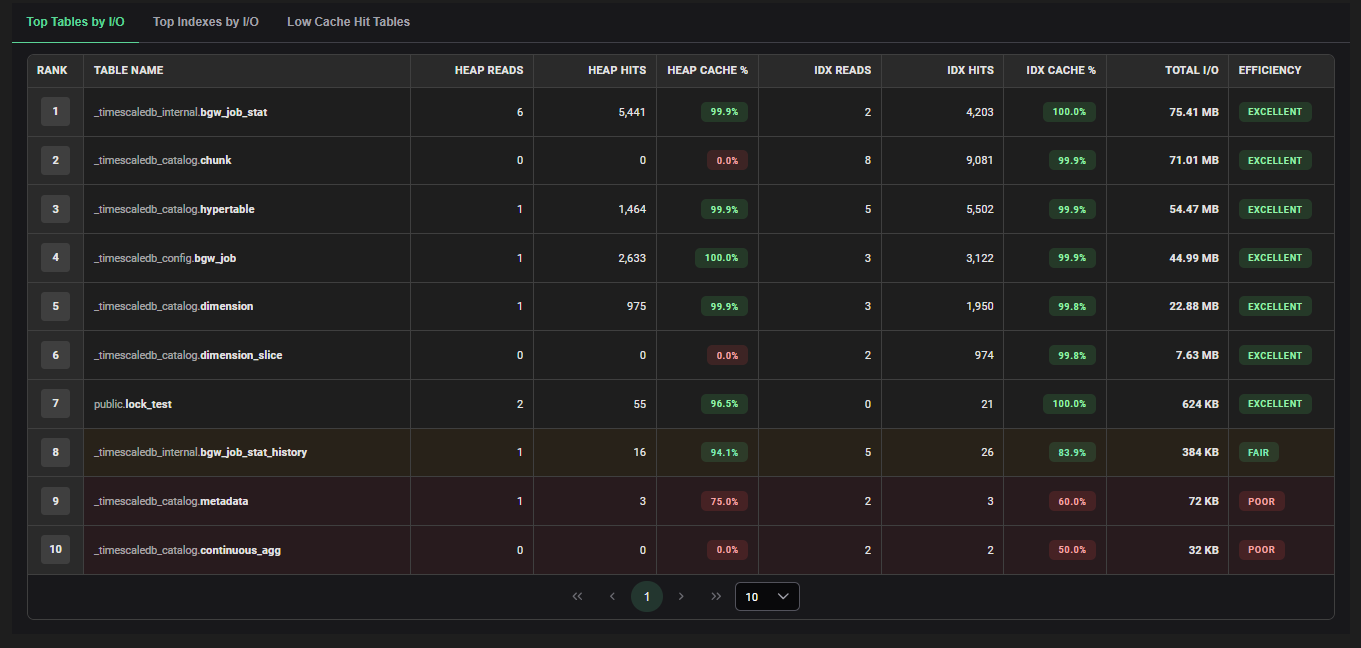
Tab 1 — Top Tables by I/O
Tables ranked by total I/O volume (disk reads + cache hits), showing both heap (table data) and index I/O separately.
| Column | Description |
|---|---|
| Rank | Position by total I/O |
| Table Name | Schema and table name |
| Heap Reads | Blocks read from disk for table data |
| Heap Hits | Blocks served from cache for table data |
| Heap Cache % | Cache hit ratio for table data — color-coded badge |
| Idx Reads | Blocks read from disk for indexes on this table |
| Idx Hits | Blocks served from cache for indexes |
| Idx Cache % | Cache hit ratio for indexes — color-coded badge |
| Total I/O | Total I/O volume in bytes |
| Efficiency | Overall I/O efficiency badge |
Cache Hit Ratio Badge Severity
| Cache Hit % | Badge | Meaning |
|---|---|---|
| ≥ 95% | 🟢 Green | Excellent — data mostly served from memory |
| 90–95% | 🔵 Blue | Good — acceptable cache efficiency |
| 80–90% | 🟠 Orange | Warning — notable disk I/O |
| < 80% | 🔴 Red | Critical — heavy disk reads, investigate |
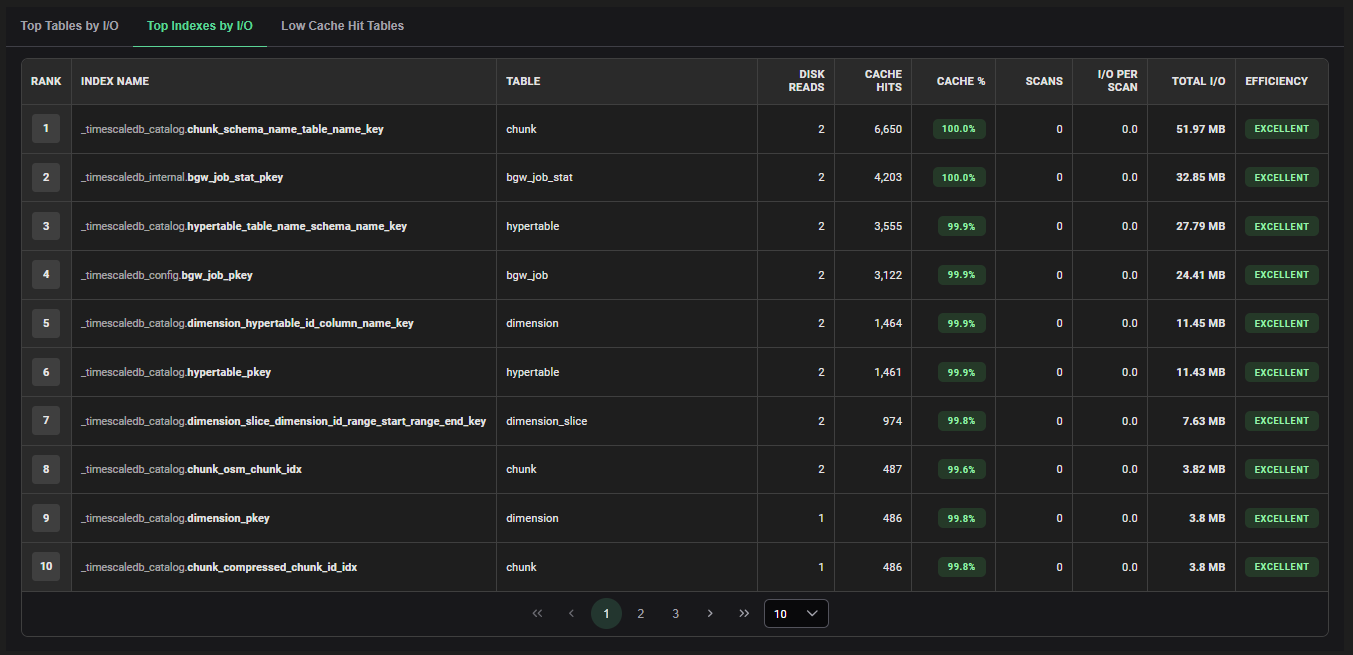
Tab 2 — Top Indexes by I/O
Indexes ranked by total I/O volume, with per-scan I/O metrics.
| Column | Description |
|---|---|
| Rank | Position by total I/O |
| Index Name | Schema and index name |
| Table | Associated table name |
| Disk Reads | Blocks read from disk for this index |
| Cache Hits | Blocks served from cache for this index |
| Cache % | Index cache hit ratio — color-coded badge |
| Scans | Number of index scans during the report period |
| I/O per Scan | Average blocks accessed per index scan |
| Total I/O | Total I/O volume in bytes |
| Efficiency | I/O efficiency badge |
:::tip High I/O per Scan
A high I/O per Scan value on an index may indicate that the index is used but inefficient — possibly a low-selectivity index, or an index on a very large table without proper statistics. Review the query using this index with EXPLAIN (ANALYZE, BUFFERS).
:::
Tab 3 — Low Cache Hit Tables
This tab is visible only when at least one table has a cache hit ratio below 80%. It lists all affected tables with severity assessment and actionable recommendations.
| Column | Description |
|---|---|
| Table Name | Schema and table name |
| Disk Reads | Blocks read from disk |
| Cache Hits | Blocks served from cache |
| Cache Hit % | Cache hit ratio — always shown as red badge in this tab |
| Total I/O | Total I/O volume |
| Severity | Severity level of the cache miss issue |
| Recommendation | Actionable recommendation for this table |

Interpretation Guide
Low Overall Cache Hit Ratio (< 90%)
The entire working dataset does not fit in memory. Consider:
- Increasing
shared_buffersinpostgresql.conf - Reviewing queries performing large sequential scans that pollute the cache
- Partitioning large tables to keep frequently accessed data hot
High Disk Reads on a Specific Table
A single table generating disproportionate disk reads is a strong indicator of:
- Missing indexes causing sequential scans
- Infrequent access patterns that cannot benefit from caching
- A table larger than
shared_buffersbeing frequently scanned
High I/O on Indexes with Low Scan Count
An index generating high I/O with few scans may be:
- A rarely used index consuming cache space unnecessarily
- A bloated index that should be rebuilt with
REINDEX CONCURRENTLY
All Tables Show Good Cache Hit Ratios
If all tables show cache hit ratios ≥ 95%, the buffer cache is well-sized for the current workload. Monitor this ratio as data volumes grow.