Checkpoint Trends
The Checkpoints tab tracks checkpoint activity over the selected time period — frequency, type (timed vs forced), buffer writes and I/O timing. Checkpoint health is a key indicator of write I/O pressure and PostgreSQL configuration adequacy.
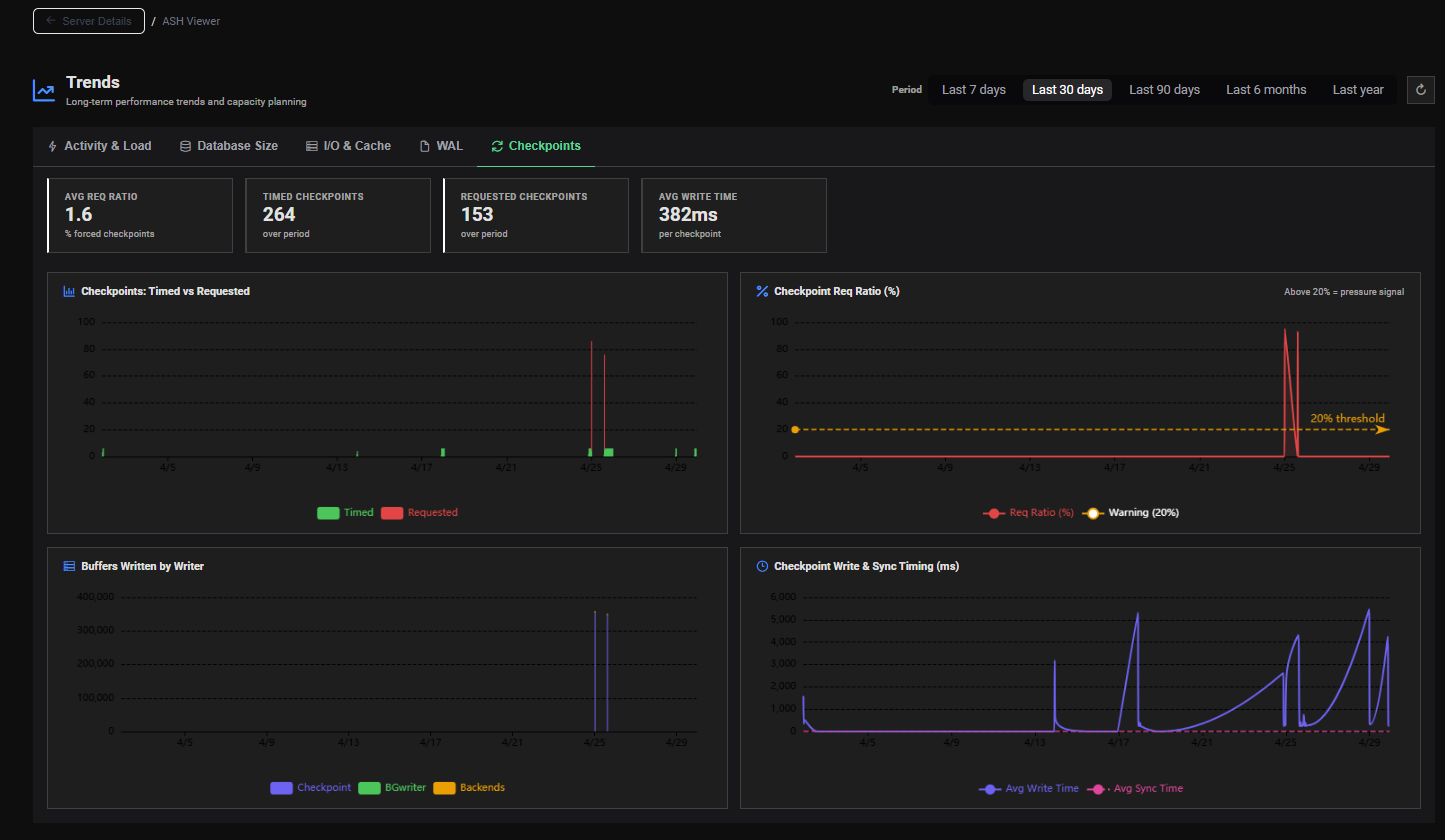
KPI Summary Cards
Four summary cards display period-wide checkpoint statistics:
| Card | Unit | Condition | Description |
|---|---|---|---|
| Avg Req Ratio | % | Color-coded by severity | Average percentage of checkpoints that were forced (requested) vs. timed |
| Timed Checkpoints | count | — | Total checkpoints triggered by checkpoint_timeout |
| Requested Checkpoints | count | 🟠 Orange if > 0 | Total checkpoints forced by WAL volume (max_wal_size) |
| Avg Write Time | ms | — | Average checkpoint write duration per checkpoint |
Req Ratio Severity
| Avg Req Ratio | Color | Meaning |
|---|---|---|
| < 10% | 🟢 Green | Healthy — checkpoints are mostly timed |
| 10–20% | 🔵 Blue | Acceptable — some WAL pressure |
| 20–50% | 🟠 Orange | Warning — frequent forced checkpoints |
| > 50% | 🔴 Red | Critical — WAL is driving checkpoints continuously |
Alert Banner
When the average Checkpoint Req Ratio ≥ 20%, an alert banner is displayed at the top of the tab:
⚠️ Checkpoint req ratio is XX% — more than 20% of checkpoints are being forced. Consider increasing
max_wal_sizeorcheckpoint_completion_target.
Charts
Chart 1 — Checkpoints: Timed vs Requested
A stacked bar chart comparing the number of timed checkpoints (triggered by checkpoint_timeout) vs requested checkpoints (triggered by max_wal_size) over time.
Use for:
- Visualizing the balance between scheduled and forced checkpoints over time
- Detecting periods where WAL generation pressure forced frequent checkpoints
- Validating that increasing
max_wal_sizeshifted checkpoints from Requested back to Timed
In a well-configured system, the vast majority of checkpoints should be Timed. Requested checkpoints indicate that WAL is being generated faster than the checkpoint interval allows — the database is under write pressure.
Chart 2 — Checkpoint Req Ratio (%)
A line chart showing the percentage of forced (requested) checkpoints over time, with a reference line at the 20% threshold.
Use for:
- Monitoring the trend in checkpoint pressure over time
- Detecting whether forced checkpoint frequency is growing (worsening write pressure)
- Validating configuration changes (
max_wal_size,checkpoint_timeout) effectiveness
When this ratio trends upward over weeks or months, it is a leading indicator that the database is becoming write-saturated and needs configuration adjustment or hardware upgrade.
Recommended fix when ratio > 20%:
# Increase max WAL size to allow more WAL before forcing a checkpoint
max_wal_size = 4GB          # increase from default 1GB

# Spread checkpoint I/O over more of the checkpoint interval
checkpoint_completion_target = 0.9   # default is 0.9 — verify it is set
Chart 3 — Buffers Written by Writer
A multi-line chart showing the number of dirty buffers written during the checkpoint period, broken down by writer:
| Series | Description |
|---|---|
| Buffers Checkpoint | Dirty buffers written during checkpoint |
| Buffers Clean | Dirty buffers written by the background writer (bgwriter) between checkpoints |
| Buffers Backend | Dirty buffers written directly by backend processes |
Use for:
- Understanding how write I/O is distributed between checkpoints, bgwriter and backends
- Detecting excessive Backend writes — a sign that bgwriter is not keeping up
- Validating bgwriter tuning effectiveness (
bgwriter_lru_maxpages,bgwriter_delay)
When Buffers Backend is consistently high relative to Buffers Clean, backend processes are flushing dirty pages themselves. This causes latency spikes for user queries during write operations. Increase bgwriter aggressiveness:
bgwriter_lru_maxpages = 200   # increase from default 100
bgwriter_delay = 50ms         # decrease from default 200ms
Chart 4 — Checkpoint Write & Sync Timing (ms)
A dual-line chart showing the average checkpoint write and sync durations in milliseconds over time.
| Metric | Description |
|---|---|
| Write Time | Time to write dirty buffers from memory to the OS page cache |
| Sync Time | Time to flush data from the OS page cache to physical disk (fsync) |
Use for:
- Detecting I/O latency degradation on the data volume over time
- Identifying storage performance regressions
- Understanding the relative cost of write vs. sync in the checkpoint process
A high Write Time indicates that writing dirty buffers to the OS is slow — the storage or I/O scheduler may be the bottleneck.
A high Sync Time indicates that fsync is slow — the physical disk cannot flush pages fast enough. This is a more serious concern as it directly impacts crash recovery safety and transaction durability.
Interpretation Guide
| Condition | Threshold | Action |
|---|---|---|
| High Req Ratio | > 20% | Increase max_wal_size |
| Growing Req Ratio trend | Sustained increase | Investigate write workload growth + WAL tab |
| High Sync Time | > 500ms | Consider dedicated faster storage for WAL/data |
| High Buffers Backend | > 20% of total writes | Tune bgwriter aggressiveness |
| Checkpoint frequency very high | > 10/hour | Increase max_wal_size significantly |